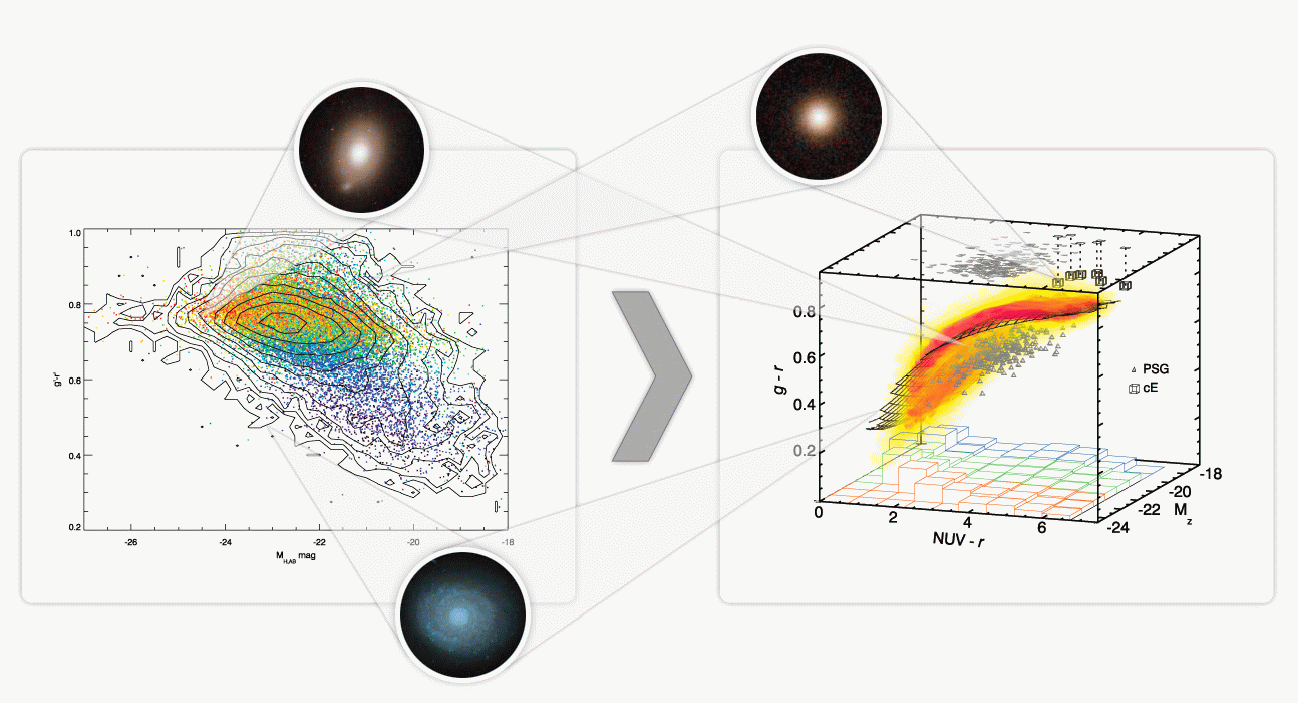
 Two-dimensional colour-magnitude diagram for the galaxies from the SDSS survey (left), and three-dimensional distribution proposed in this study (right). Each point on both diagrams represents a galaxy as demonstrated in the example close-ups for lenticular, spiral and compact elliptical galaxies. X axis of left panel shows galaxies luminosity, whereas Y axis - their optical colour g-r. Ultraviolet colour NUV-r has been added to these two axes leading to a 3D diagram, and the diagram was rotated for better view, so that new NUV-r dimension spans from left to right in the picture. Thin distribution of 200 000 galaxies is shown in red and yellow, whereas individual symbols correspond to outliers.
Normally, ground-based images of distant galaxies are neither sufficient for determination of galaxy properties, nor for the distance estimates. Additional data such as spectra or high-resolution images using a space telescope are required. It is clear however, that astronomers are physically unable to study millions of known galaxies at such level of detail, though it is still important to understand their basic properties. Igor Chilingarian (Harvard-Smithsonian Center for Astrophysics, formerly Strasbourg Observatory and Paris Observatory) and Ivan Zolotukhin (Paris Observatory) have recently come up with a solution of this problem. They first have utilized the Virtual Observatory to assemble a multi-wavelength catalogue of 200 000 galaxies by cross-identifying them in 3 major publicly available photometric surveys of the same region in the sky spanning ultraviolet, optical, and near-infrared spectral domains: Galaxy Evolution Explorer (UV), Sloan Digital Sky Survey (optical), UK Infrared Telescope Deep Sky Survey (NIR). Then, they thoroughly studied this compiled catalogue of galaxies with known distances and discovered a new representation that shed light on how essential properties of different galaxies are interconnected with each other. Adding the third dimension with the UV colour to the widely used optical colour-magnitude diagram reveals that galaxies that were traditionally grouped into two distinct families on the 2D diagram (so called "red sequence" and "blue cloud"), now follow a single smooth and thin monotonic relation. To the surprise of researchers, it turned out that a vast majority of 200 000 galaxies selected from imaging surveys have their observed optical and ultraviolet colours and luminosities tightly connected, also related to their intrinsic properties. The physical reason of this behaviour is not yet clear and becomes another challenge to theorists and those researchers who study galaxies by means of numerical simulations.
The fact that in the 3D colour-colour-magnitude space, all galaxies are distributed around a thin smooth surface will allow astronomers to classify and measure distances to millions of them using only their images. It now becomes possible to determine the galaxy morphology, that is, to say whether a stellar system is a spiral or an elliptical, for distant galaxies where we cannot see their structure directly and can measure only the total flux. Another important consequence can help to better study and understand whole zoo of galaxy species: representatives of certain galaxy types which are presently considered rare, such as compact elliptical galaxies, become very easy to spot even with few data as they are outliers from this universal relation. There might be other numerous applications coming from this discovery in extragalactic astronomy, like selection of galaxy clusters members with such a minimalistic set of data.
More information: A universal ultraviolet–optical colour–colour–magnitude relation of galaxies, MNRAS 11 January 2012: Vol. 464 issue 2 pp. 1727-1739. DOI: 10.1111/j.1365-2966.2011.19837.x